School Administrator Magazine
AASA's award-winning magazine provides big-picture perspectives on a broad range of issues in school system leadership and resources to support the effective operation of schools nationwide.

Current Issue
School Administrator: The Multigenerational Workforce & The Modern Workplace


Advertisement
Previous Issues
-
 April 2026: School Administrator
This issue examines how leaders can manage varying workplace expectations and conflicts in a modern world.
-
 March 2026: School Administrator
This issue examines the case for placing Real Skills for Real Life at the center of schooling.
-
 February 2026: School Administrator
This issue examines how school districts benefit when a school district’s incoming and outgoing superintendents collaborate.
-
 January 2026: School Administrator
This issue examines various methods for approaching effective career readiness and student-centered learning.
-
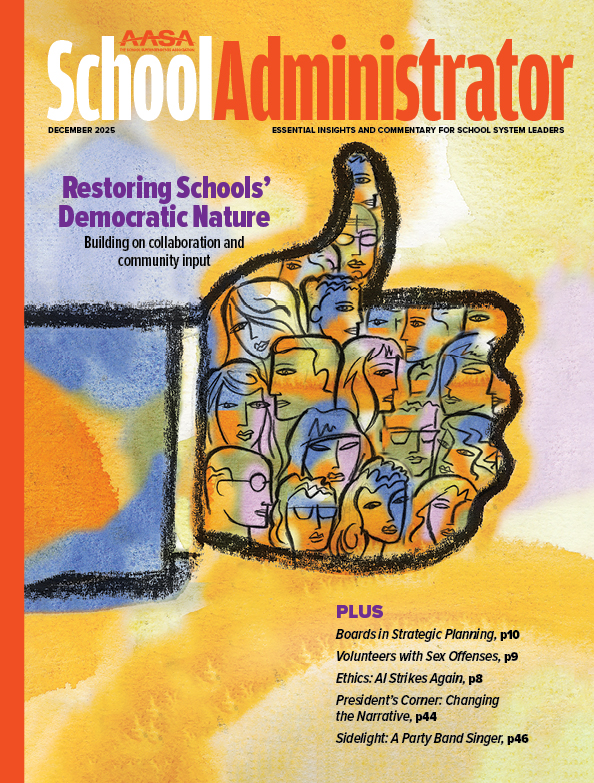 December 2025: School Administrator
This issue examines how public school districts can build strong relationships with their communities and make their schools a top choice for families.
-
 November 2025: School Administrator
This issue examines how superintendents apply their faith to their leadership. Plus, finding common ground on religion in public schools.
-
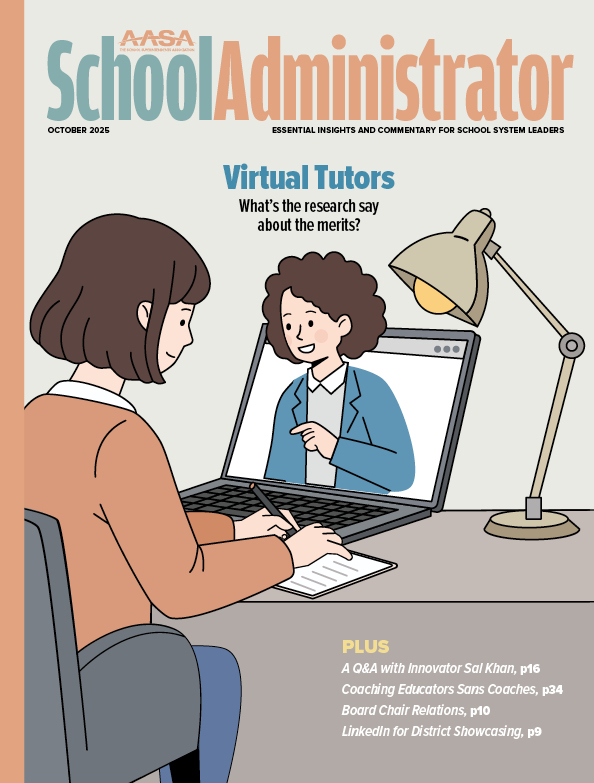 October 2025: School Administrator
This issue examines how school districts are expanding new methods of tutoring and professional coaching.
-
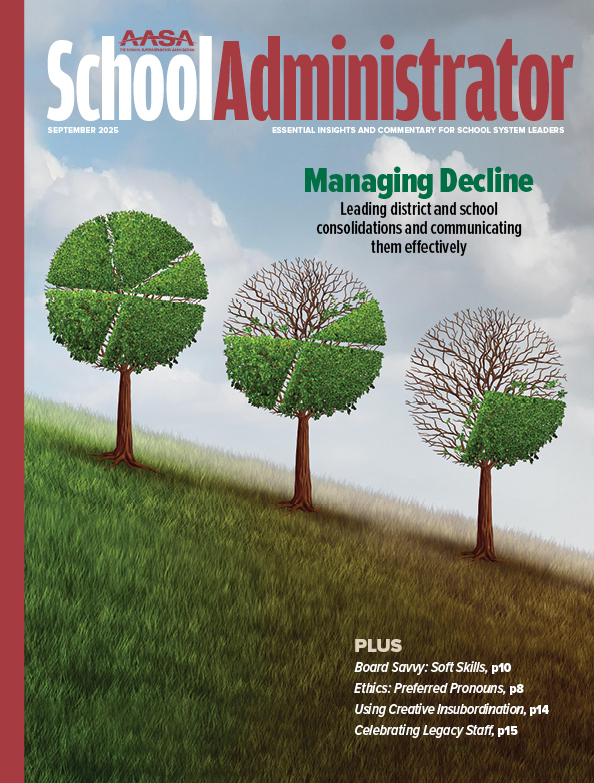 September 2025: School Administrator
This issue examines solutions and strategies for superintendents handling enrollment decline, school mergers and closures in their school districts.
School Administrator Staff


Advertise in School Administrator
For information on advertising with AASA, contact Kathy Sveen at 312-673-5635 or ksveen@smithbucklin.com.
Advertisement
Advertisement