Beyond Compliance: Turning District Data into Action and Advocacy
September 29, 2026
Author

When we consider all the data available in a school district, it’s rather overwhelming. From standardized test data, report card data, student and staff attendance, student participation in co-curriculars, graduation rate, and more - we’re swimming in data! It’s time to shift our mindset from data being a backward glimpse in the rearview mirror. Really, it’s a tool we can use to highlight our strengths, set goals, and navigate the complexities of post-pandemic learning.
If we want to move from "compliance" to "advocacy," we have to change how we tell the story of our schools. Here is how we do it.
1. Solving the "Empty Chair" Crisis
The numbers on chronic absenteeism in Maine are sobering. Right now, nearly 25% of our students are missing 10% or more of the school year. And, we’re certainly not alone in this.
We can have the best curriculum in the world, but we can’t teach kids who aren't in the room. Students who are chronically absent are significantly less likely to meet grade level standards - and are far more likely to drop out of school. Tracking student report card grades in upper elementary and middle school is an early intervention that keeps students feeling successful. Because, we know that when students get “comfortable” with failing grades, it becomes a self-fulfilling prophecy. Once students accept academic failure as their norm, disengagement deepens, turning chronic absenteeism and eventual dropout from a risk into a near certainty.
Our middle and high school principals maintain a spreadsheet that tracks students with grades of D/F each marking period. This prompts a quarterly conversation about many elements:
Is there a trend by class, teacher, or subject area? (For example, does one Geometry teacher have multiple students failing class while another Geometry teacher’s students fare much better?)
Is a student having trouble in just one class - or are they failing multiple subjects?
What systems of support are in place? Is the student receiving tutorial help, attending Homework Lunch Club, or visiting Intervention teachers?
Sometimes these conversations lead to discussions with teachers about grading practices - particularly when there aren’t enough summative assessments and one bad grade can tank a student’s report card. Most of the time, however, it’s a great opportunity to help a student be successful and get them out of a downward spiral.
2. Give Teachers the Professional Support They Need
Data such as AP test scores, standardized ELA and Math scores, and enrollment trends in honors level classes all offer a glimpse into what teachers may need to better support their students. Low AP scores? Check out College Board’s workshop offerings. Small Honors Level classes? Maybe it’s time to engage in professional development in supporting our strongest readers and writers. Student data sometimes draws a line back to teacher training. Let’s not ignore that.
One of our AP teachers concluded the year with students’ exam results averaging 2.8. With some targeted professional development and regular review of lessons to ensure the appropriate level of rigor was in place, that teacher’s class exam results rose to 3.6 the following year. Another AP teacher’s scores rose from a mean score of 2.4 to 3.5 the following year when she made adjustments to her novel selections and pacing.
3. Connect The Dots With Correlating Data
Elementary running record scores are usually a reliable indicator of how students will perform on standardized assessments. Use your school’s Data Wall to identify the students who may not be part of an intervention cohort, but still would benefit from reading comprehension support or fluency work. Our district recently implemented Math Running Records in grades K-4; this gives us additional benchmark data to inform our intervention efforts. There are rarely surprises when students don’t perform well on standardized tests. Use predicting data.
4. Celebrate ALL the Graduates!
Whether your community is fully college-bound or whether you’re in a rural community where most students head right to work after graduation, frame your post-graduation data in a way that celebrates your school and your students. Perhaps your high school has a strong JROTC program where between 5 and 10% of graduates head into the military or flight school. This is great data to share with your community.
In my rural community, nearly 20% of students go directly to work after graduation. We focus their junior and senior level English classes on resume development, letter-writing skills, interview preparation, and customer service skills. These students know what they’ll be doing after graduation because they don’t wait until June to apply for jobs. They apply while they’re still in school and have supportive teachers and counselors to support their application process. That’s worth celebrating!
The Next Chapter
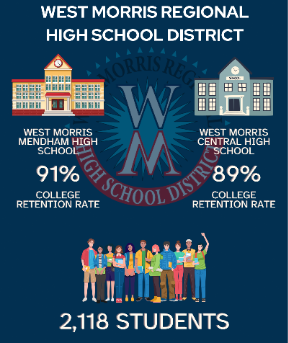
A picture tells a thousand words. What does your district’s data picture say about your learning community? Next month’s blog focuses on using infographics to brand your school, celebrate your achievements, and stand out in the academic community. Here’s a quick peek at what’s coming next!