What’s Your Community Thinking? Survey Methodology Defines What You’ll Hear
February 01, 2022
The authors contrast opt-in and random-sample approaches to public feedback in the buildup of a referendum campaign

A wiser version of the cartoon character Wizard of Id could have avoided his bad awful day by paying attention to the importance of methodology before his full-time jester and part-time survey consultant proclaimed, “Your numbers are up in the latest
poll!”
The Wizard’s excitement and animated “Great!” response were short-lived, however, as the jester peeled the onion back on his data analysis: “Lousy” went from 80 to 90 percent.
School leaders are
increasingly harnessing the power of community surveys to support decision making related to school tax elections seeking funding for operations or facilities. This need is fueled by heightened polarization, the impact of social media and increasing
demographic-related barriers to passage. The U.S. Census estimates that by 2030, people over 65 years of age (78 million) will exceed the total number of school-age children (76.7 million).
Demographic challenges are complicated further
by the diminishing number of parents available to cast a ballot on Election Day. In the vast majority of school districts, parents of school-age children account for fewer than 25 percent of registered voters. Reliable survey data — testing
both the content of a future ballot proposal and the community’s willingness to pay — never have been more important to success.
This Content is Exclusive to Members
AASA Member? Login to Access the Full Resource
Not a Member? Join Now | Learn More About Membership
Author
About the Authors
Don Lifto, a former superintendent for 25 years, is a director with Baker Tilly Virchow in St. Paul, Minn.
William Morris is co-founder of Morris Leatherman Company in Minneapolis, Minn., and a consultant in the public sector.
Two Surveys, Two Divergent Findings
 In preparation for a school tax election seeking additional operating money to support classroom programs, the Anyville Public Schools contracted for a scientific, random-sample survey to test support for key components of its educational plan and the
community’s tax tolerance.
In preparation for a school tax election seeking additional operating money to support classroom programs, the Anyville Public Schools contracted for a scientific, random-sample survey to test support for key components of its educational plan and the
community’s tax tolerance.
Anyville (a pseudonym for a school district we’ve worked with), located 40 miles outside of a metropolitan area, serves multiple cities and townships. The district’s K-12 enrollment of just under
4,000 students is served in four elementary schools, one middle school and one high school.
The methodology in the district’s scientific survey included 350 random-sample interviews and a phone interview of about 30 probes, yielding a
margin of error of plus or minus 5.2 percent at the 95th confidence.
The random interviews were controlled for demography, including age, gender, parent status, geography within the district and past voting frequency. The intent of these
targets was to have the makeup of interviewees closely mirror the demographic profile of all registered voters in the district.
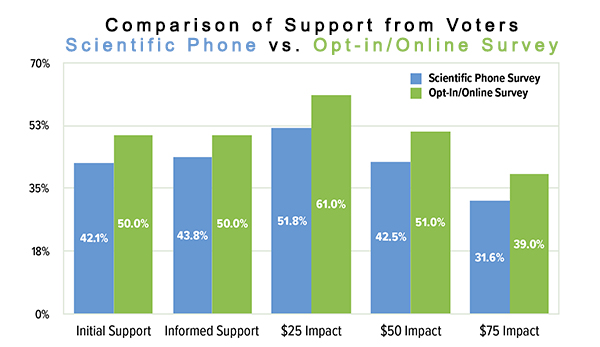
The survey used three benchmarks that initially tested support for the proposal before information, then measured
support after information, and last evaluated reaction to potential tax increases. The initial reaction to the district’s proposal was tepid with 42 percent support and 58 percent closely split between opposition and undecided. After providing interviewees
with nine examples of both positive and negative consequences related to the desired funding, support was tested a second time. Unfortunately, information only increased support 2 percent with 56 percent still either opposed or undecided.
The
final test sought reaction to three potential tax increases of $25, $50, and $75 per year on a $100,000 of property value. Only the $25 impact measured above majority support at 51.8% (potentially below 47 percent given the margin of error). Complicating
things further was the fact that the most active voters were 3 percent to 9 percent less supportive.
On a separate probe, more than half of respondents said they would not support a tax increase of any amount for any purpose.
Opt-in Survey
Anyville followed the scientific survey with an opt-in survey completed by nearly 1,100 residents. Demographic makeup of survey takers was unrepresentative with 22 percent more females than males, nearly 60
percent of respondents between ages 35 and 54, only 20 percent were ages 55 or older, and 67 percent of the respondents were parents of school-age children.
Not surprisingly, this unrepresentative sample — self-selected and based on self-interest
— projected significantly higher support on all data points, measuring an average of more than 8 percent higher support for the three tax increases.
The Anyville case study reinforces the importance of school leaders matching survey methodology
with key decision making. The opt-in survey estimated support at the $25 impact at a comfortable margin of 61 percent while the scientific survey projected between 47 percent and 57 percent. On Election Day, fewer than 48 percent of community residents
voted to approve Anyville’s ballot question.
Advertisement
Advertisement


.png?sfvrsn=3d584f2d_3)
Advertisement
Advertisement