Demographic Evolution
December 01, 2021
State of the Superintendency
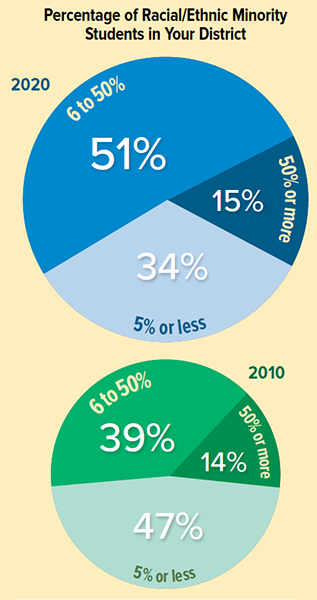 The racial/ethnic
diversity of school districts in which superintendents work has increased markedly over the past 10 years. In 2020, only 34 percent of superintendents responding to an AASA nationwide survey worked in districts in which fewer than 5 percent of the students
were non-white compared to almost 50 percent a decade before.
The racial/ethnic
diversity of school districts in which superintendents work has increased markedly over the past 10 years. In 2020, only 34 percent of superintendents responding to an AASA nationwide survey worked in districts in which fewer than 5 percent of the students
were non-white compared to almost 50 percent a decade before.
The 2020 survey showed an increase in the percentage of racial/ethnic minority students being served. Today, more than 51 percent of districts serve between 6 to 50 percent racial/ethnic
minority students compared to only 39 percent of districts in 2010.
The change underscores the country’s demographic evolution.
SOURCES
AASA decennial superintendency studies, 2010 and 2020
Advertisement
Advertisement

.png?sfvrsn=53cf74f6_7)

Advertisement
Advertisement